Learn more about the most important key figures of the chatbot.
Statistics
Focus reports
Exports
In the statistics menu, the most important key figures for the chatbot in a specific period can be viewed. There are also focus reports for the top topics, conversations and user requests. Exports can also be created for the focus reports - as a PDF or .csv file.
1. Statistics
The statistics provide an overview of the following key figures:
- Conversations
- Automation
- Positive and negative ratings
- Conversions
- Human Takeovers
- Top relevant Intents
The period for which the statistics are to be displayed can be selected from the drop-down menu at the top. By default, the results of the last 28 days are displayed. If the chatbot has multiple channels, a specific channel or all channels can be selected via the drop-down menu.
Without channels:
![]()
With channels:
![]()
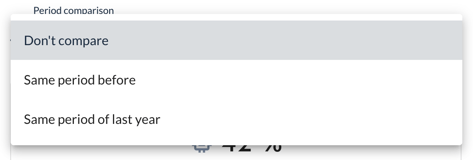
It is also possible to compare time periods. To do this, select from the drop-down menu which period should be compared or whether no comparison should take place:
2. Focus Reports
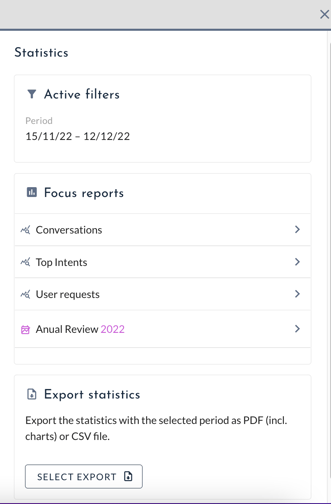
The focus reports can be accessed via the ![]() -symbol at the top right. Clicking on it opens a box on the right-hand side in which the various reports for the previously selected period are displayed:
-symbol at the top right. Clicking on it opens a box on the right-hand side in which the various reports for the previously selected period are displayed:
Focus Report Conversations
This report shows the number of conversations for the selected period in a graph.
In addition, the average duration per conversation, the number of topics per conversation and the distribution of conversations by day of the week and time of day are displayed. For the distribution of conversations, it is possible to select whether the data should be shown for all topics or only for a specific topic.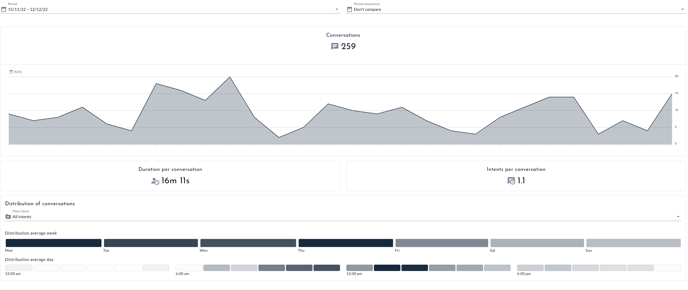
Focus Report Top Intents
This report provides detailed information on when which topic was accessed in the selected period. It also gives an overview of the topics with the greatest impact and potential. The AI proposals are also presented sorted by relevance.
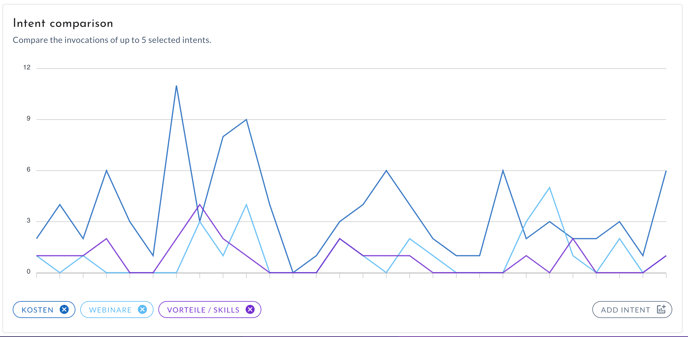
- Comparison on Intents
The views of the themes are shown in a diagram. You can add up to 5 themes for comparison.
Representing 1 Intent:
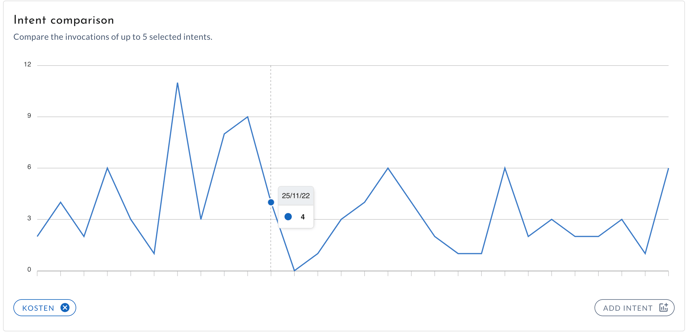
Comparing Intents:
- Biggest Intent
The intents that provide the greatest added value for users are listed here, measured by the number of views, positive ratings and conversion goals achieved. - Biggest potential
The intents that offer the greatest potential for optimisation are listed here because they are accessed particularly frequently and receive a relatively high number of negative user ratings. - AI Suggestions (Dreaming)
All current suggestions of the AI for new intents based on the needs of users are presented and sorted by relevance. This listing does not refer to the defined period.
By default, the top 5 intents are displayed. Below, you can set how many intents should be displayed per page. The arrow buttons can be used to switch between the pages.
Focus report User requests
This report takes you to the User Insights section.
All user enquiries on existing topics appear there, which can be filtered by user ratings and intents.
Focus Report Annual Review
This report summarises the key figures of the year. In addition, the top 5 themes of the year, the top month, the top day of the week and the top time are presented.
3. Exports
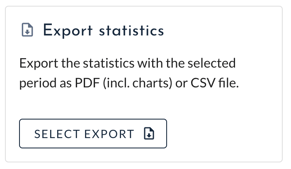
There is an option in the moinAI Hub to export all key figures of a period of the overview as a PDF or .csv file.
Focus reports of a selected period can also be exported as PDF. To do this, select the respective report by clicking on the![]() - icon in the top right-hand corner and then download the corresponding PDF in the side menu bar in the bottom right-hand corner under Export focus report.
- icon in the top right-hand corner and then download the corresponding PDF in the side menu bar in the bottom right-hand corner under Export focus report.
In the overview, the export takes place after clicking on the ![]() -symbol in the top right-hand corner.
-symbol in the top right-hand corner.
There is a choice of:
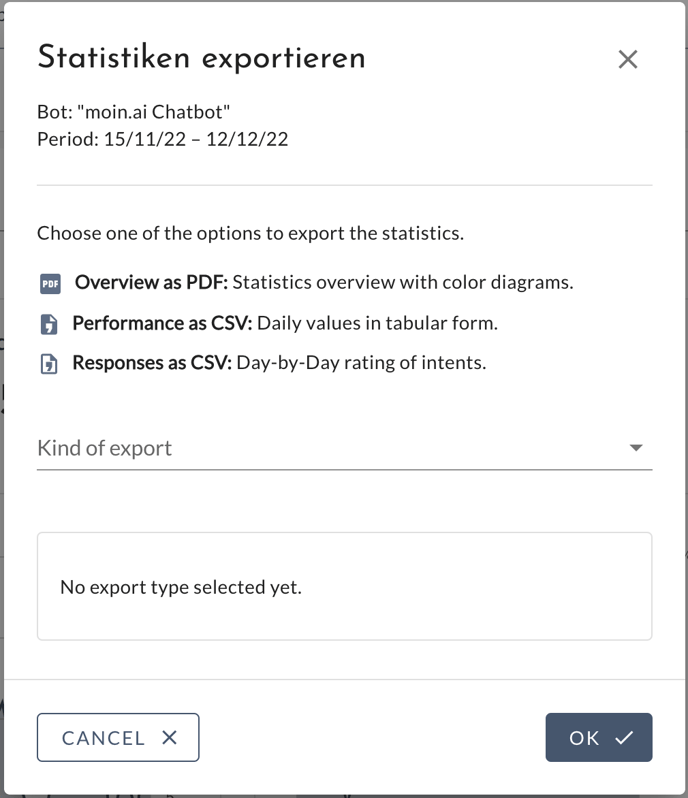
- Overview as PDF: Statistics overview with coloured diagrams.
- Performance as CSV: Daily values in tabular form.
- Responses as CSV: Day-by-day evaluation of the intents.
Interactions of website visitors with the AI chatbot can additionally be transferred to analysis tools. This article describes how tracking can be set up.